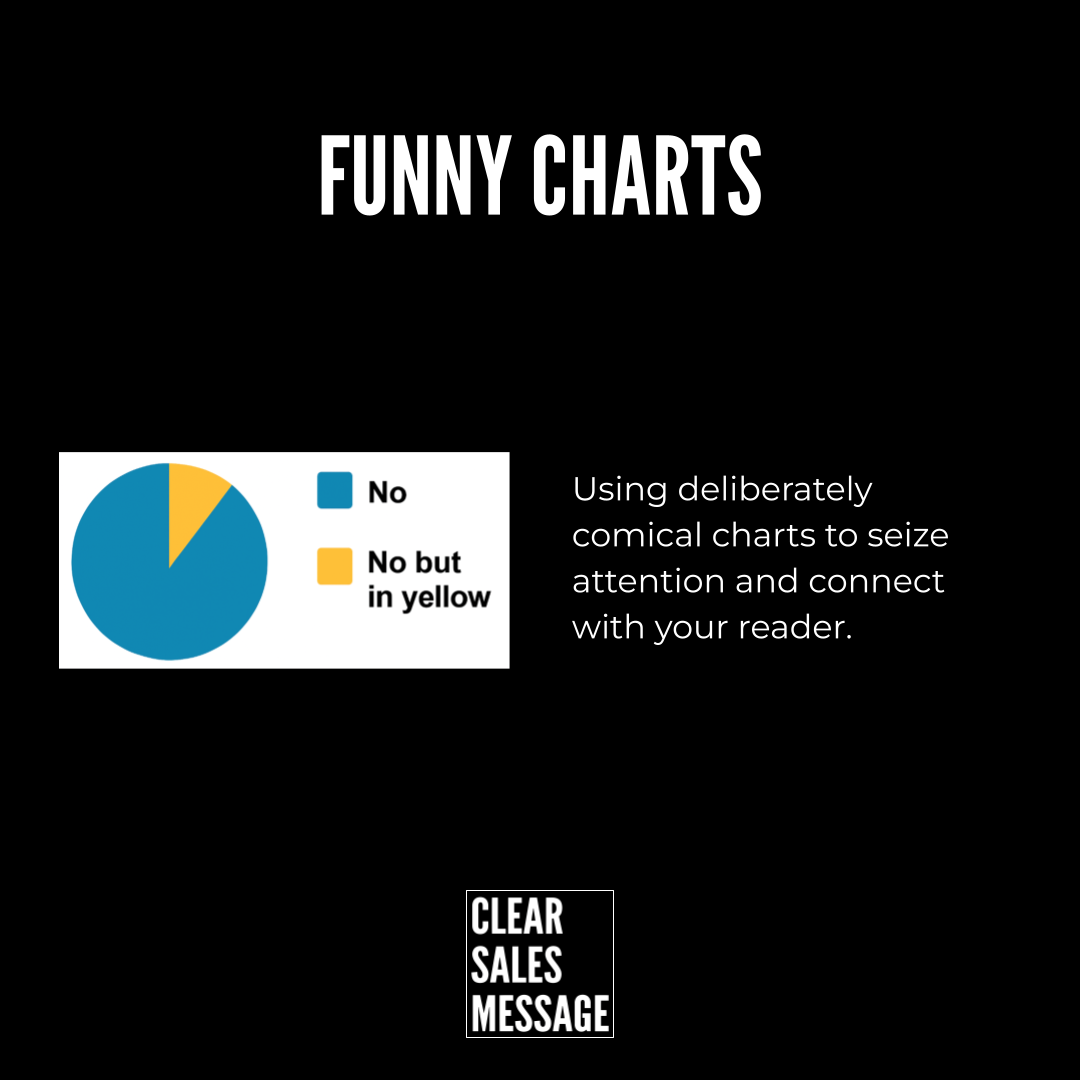
Practical Sales Training™ > How To Get Attention > Funny Charts
Funny Charts
Most charts get ignored. People have seen too many bar graphs and pie charts to care. But a Funny Chart breaks that habit because it does something unexpected.
It looks like data. Then it surprises you. That moment of surprise is what makes it work.
In sales and marketing, attention is everything. So anything that earns a second look is worth understanding.
What Is a Funny Chart?
A Funny Chart is a visual that uses the format of a real chart but delivers a joke, irony, or a truth people recognise. It looks serious at first glance. But when you read it, you get the twist.
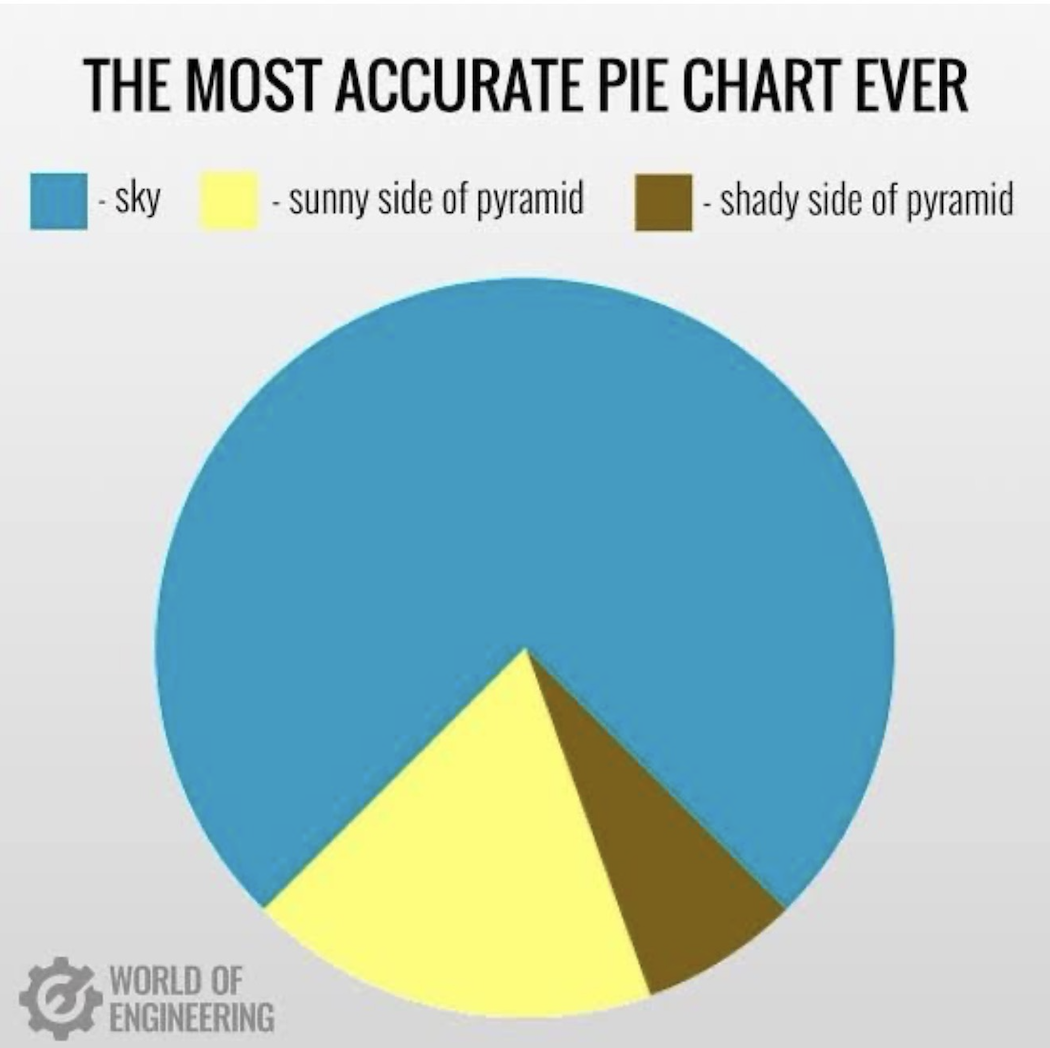
For example, a pie chart labelled “The Most Accurate Pie Chart Ever” that turns out to be a pyramid shape instead of data. The format says chart. The content says something else entirely.
That gap between expectation and reality is what makes it funny. It is also what makes it memorable.
Why Does a Funny Chart Work?
A Funny Chart triggers a pattern interrupt. When your audience sees something familiar that suddenly behaves differently, their brain pays attention. It has to, because the pattern broke.
That moment of surprise does three things. It makes people stop and look longer, because it is different. Humour then creates a positive feeling that builds instant warmth. Emotion also locks in the point, because memory sticks to feeling.
So a Funny Chart is not just about getting a laugh. It uses contrast and feeling to make your message stick in a way plain data cannot.
How Can You Use a Funny Chart In Sales?
1. Open a presentation
Start with a funny or ironic chart to get people smiling before you show the serious data. For example: “Emails marked urgent vs emails that actually are.” It sets a relaxed tone and warms the room fast.
2. Break up a data-heavy pitch
After a few real graphs, drop in one playful chart to reset attention. For example: “Time spent working vs time spent explaining what we do.” A short laugh gives the audience a moment to breathe, so they stay engaged longer.
3. Show empathy with your buyer
Use humour to reflect a pain or truth your audience knows well. For example: “Customer happiness vs Wi-Fi strength.” When buyers see their own frustration reflected back, they feel understood rather than sold to.
4. Build brand personality
Humour done well signals confidence. It shows you do not need to hide behind jargon or spreadsheets. As a result, buyers trust you more because you feel human rather than corporate.
5. Create shareable content
Funny Charts spread because they are easy to understand, visual, and light. They work well on social media or in internal comms, so they extend your reach without extra effort.
When a Funny Chart Works Best
A Funny Chart works best when the audience already feels some pressure or boredom. A room full of tired people watching a data-heavy pitch will respond well to a well-timed visual joke.
The best ones reflect a shared truth. They make people nod and laugh at the same time – saying “yes, that is exactly what it is like” without needing any words to explain it.
They also work well early in a relationship. When you meet a buyer for the first time, a Funny Chart can break the ice faster than any opener, because it shows personality without risk.
When a Funny Chart Becomes Dangerous
The risk is misjudging the room. A joke that lands in a relaxed discovery meeting may fall flat in a formal board review. So always consider the setting before you use one.
Timing matters too. If your message is serious – for example dealing with a complaint or a missed target – a Funny Chart will feel dismissive. Save it for moments when the mood can handle it.
Overuse is the other danger. One well-placed Funny Chart is memorable. Three in a row starts to feel like you are avoiding the real point, so use them sparingly to keep their impact.
Common Funny Chart Mistakes
Making it too clever
If you have to explain the joke, it has not worked. A Funny Chart should land in seconds. However, if it needs a caption or a verbal walk-through, it loses its punch and slows the room down.
Using humour that excludes
A Funny Chart works when everyone in the room gets it. So avoid inside jokes, industry jargon, or references that only some people will understand. When part of the room is lost, the moment dies.
Forgetting the point
The chart should still connect to your message. Funny for the sake of funny is just noise. Instead, make sure the humour reinforces the idea you want people to take away.
Funny Charts – An Example
In this example, the chart represents a pyramid. But it takes a second to see it, because the format tricks your eye into expecting something else. That pause is the whole point.
See Also